Python agent
What is Python agent?
The Python agent is an AI-powered tool that executes Python code to analyze data from your workbooks and generate diverse outputs, including tables, charts, and detailed explanations. This agent is particularly useful for in-depth data analysis, visualization, and transformation.
The Python agent offers the following enhanced data analysis and visualization capabilities:
-
Code generation and execution: It can understand your natural language queries and generate executable Python code to perform data analysis.
-
Multi-format output: The Python agent can provide results in multiple formats for a single query, including:
-
Working Python code: It displays the actual Python code used to generate the analysis.
-
Detailed explanations: It analyzes the output of the Python code and provides comprehensive explanations of the results.
-
Tables (data frames): It generates and displays data in a tabular format.
-
Charts and visualizations: It can create various chart types (e.g., bar charts, scatter plots) to visually represent the data. These charts are often interactive, allowing for hovering, zooming, and displaying labels.
-
-
Streaming responses: The agent supports streaming responses, meaning you can see the output being generated in real-time as the analysis progresses.
Configuring the Python agent
Configuring the Python agent involves selecting a workbook as its data source.
-
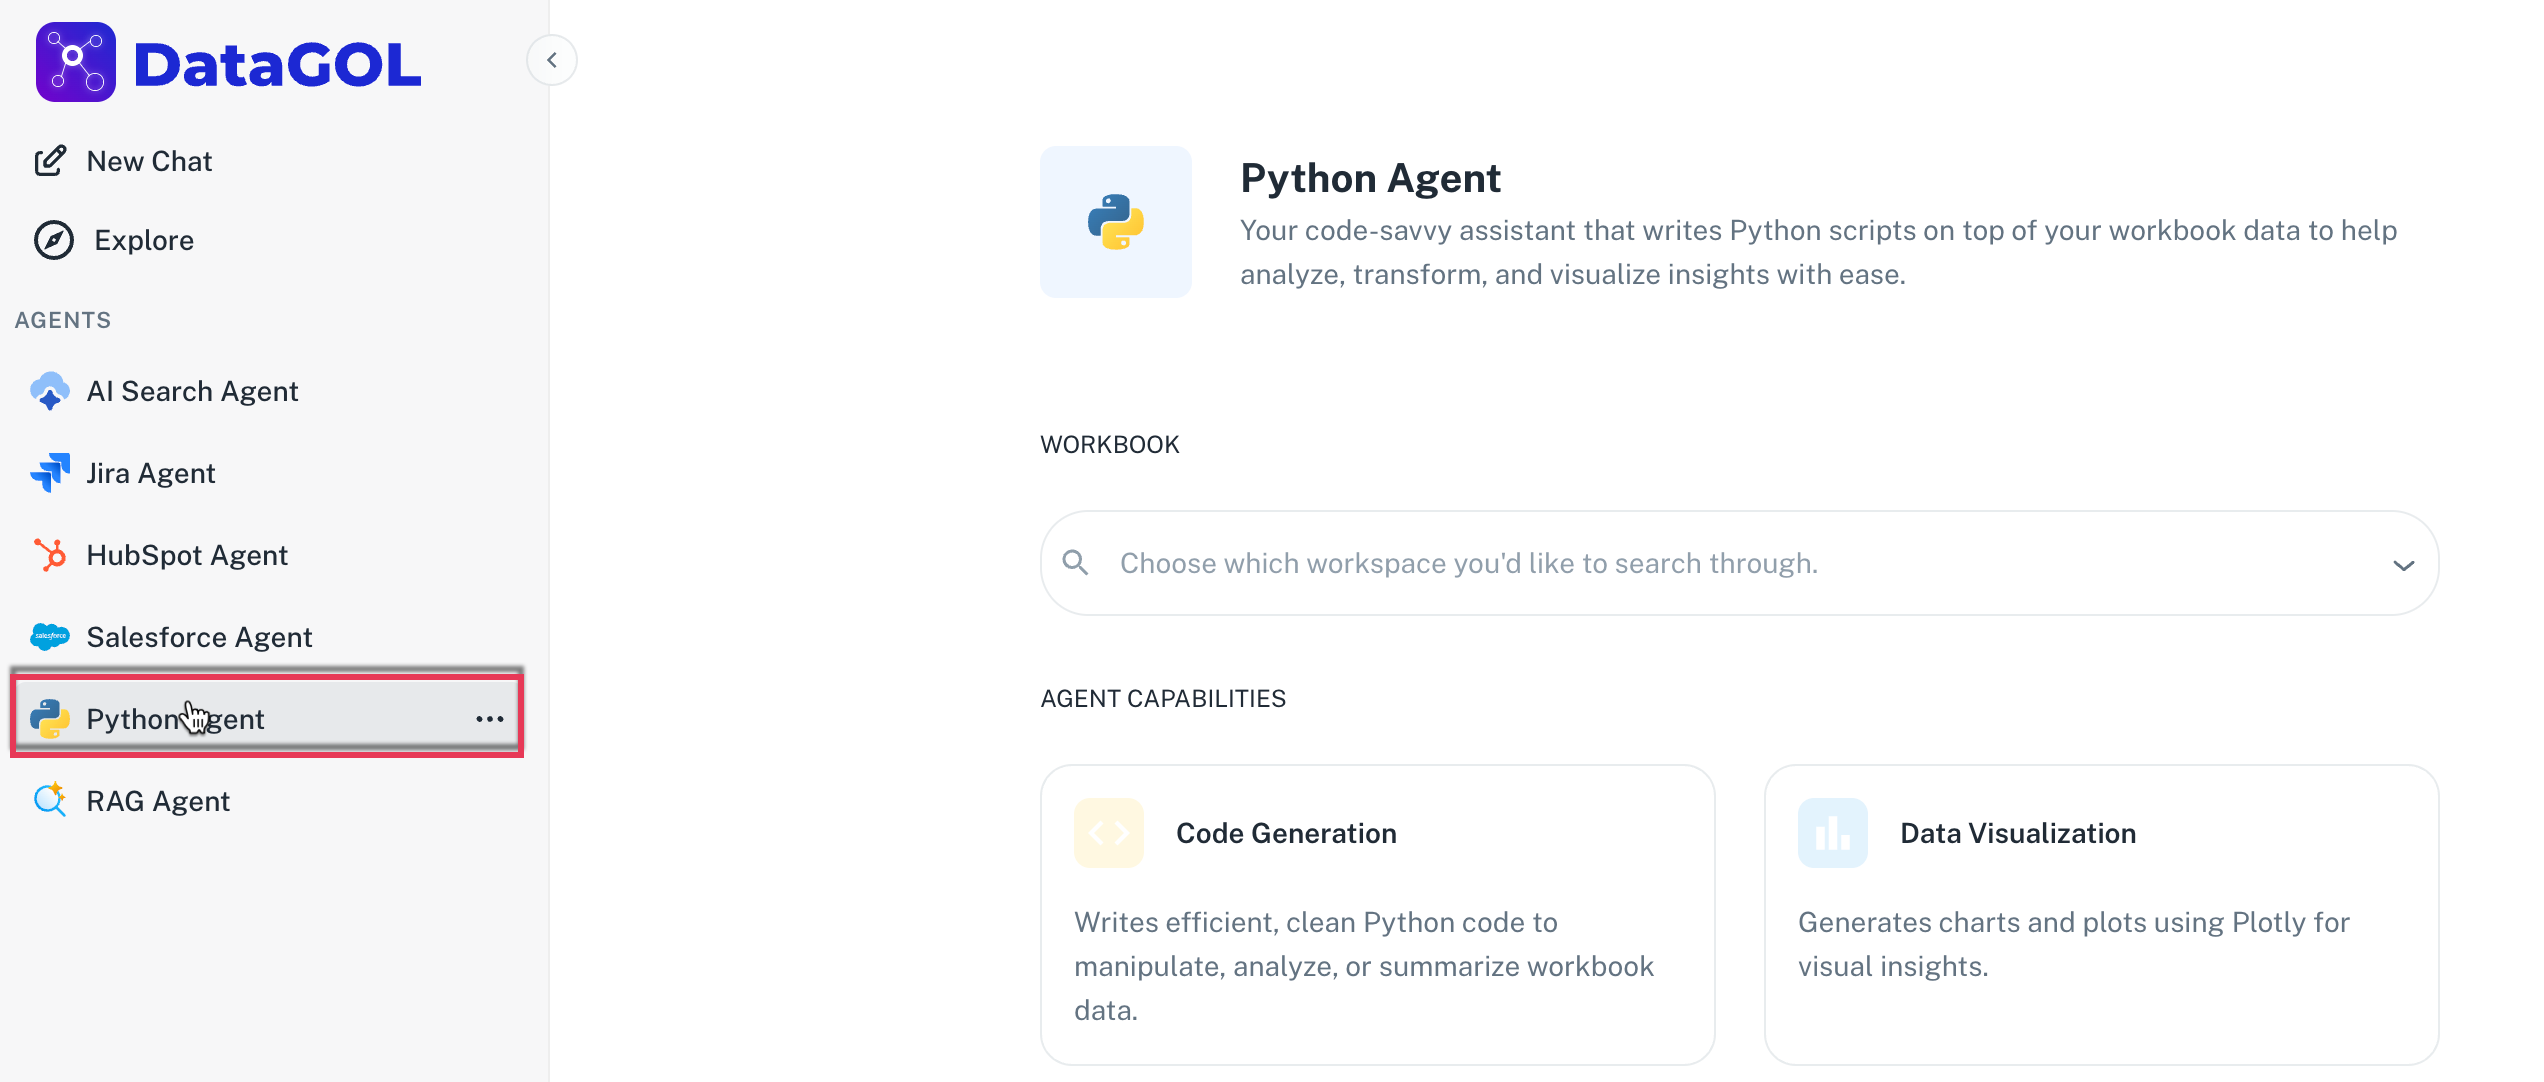
Navigate to the Python agent within the platform.
-
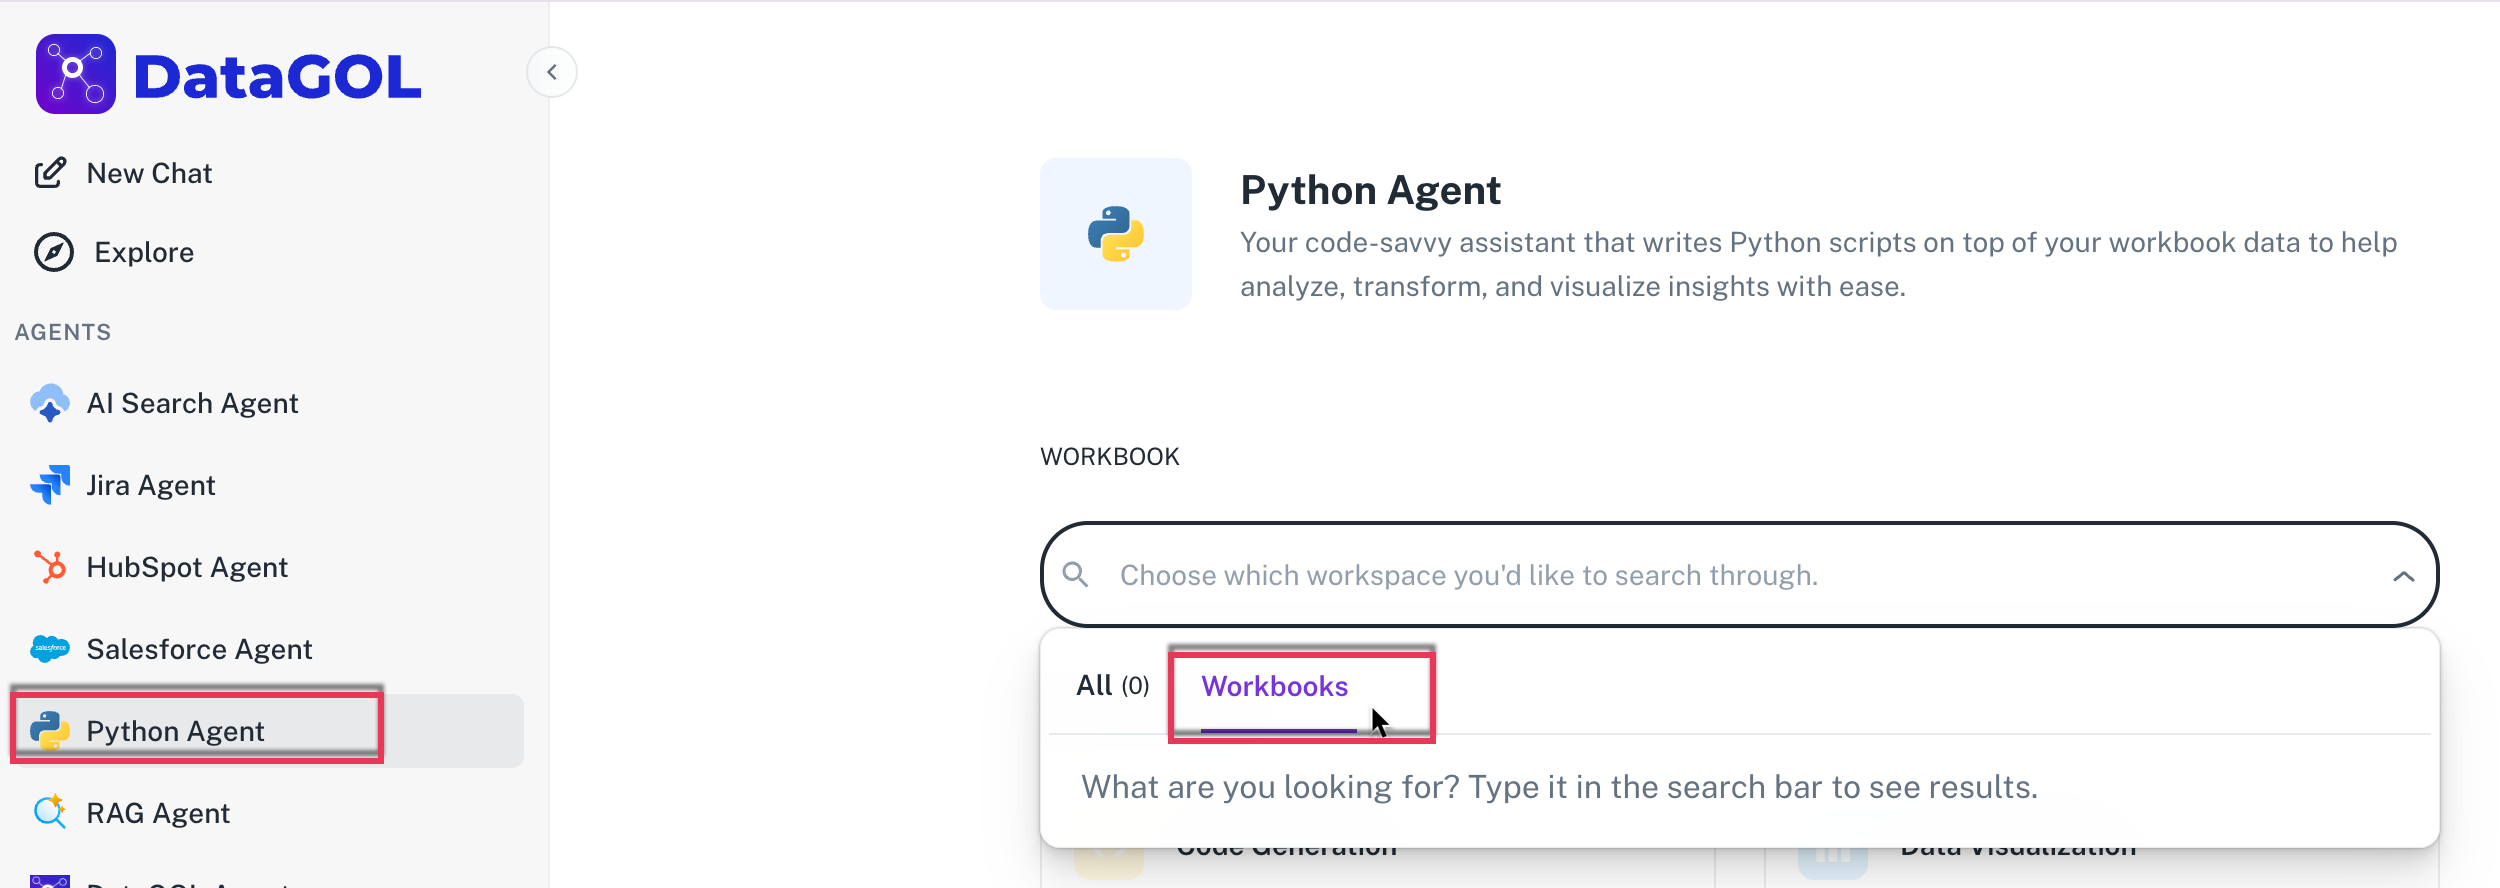
You will see an option to select a workbook. Choose the workbook that contains the data you wish the agent to analyze. This workbook could be one you have uploaded as a CSV, or exported from a query or pipeline.
:::[Info] The agent will use the data within the selected workbook for all its analyses. :::
Using the Python agent
Once the workbook is selected, you can start posing questions to the Python agent.
Examples of usage:
-
"Which patient profile (age, condition, medication) are most likely to be readmitted within 30 days?"
-
"Analyze the sales data for the last quarter and show me the top 5 performing products."
-
"Visualize the relationship between customer demographics and purchase frequency."
The agent will then process your query, generate and execute Python code, and present the results in various formats (code, explanation, tables, charts) as appropriate.
Was this helpful?